GWS 2021: Buying the toys
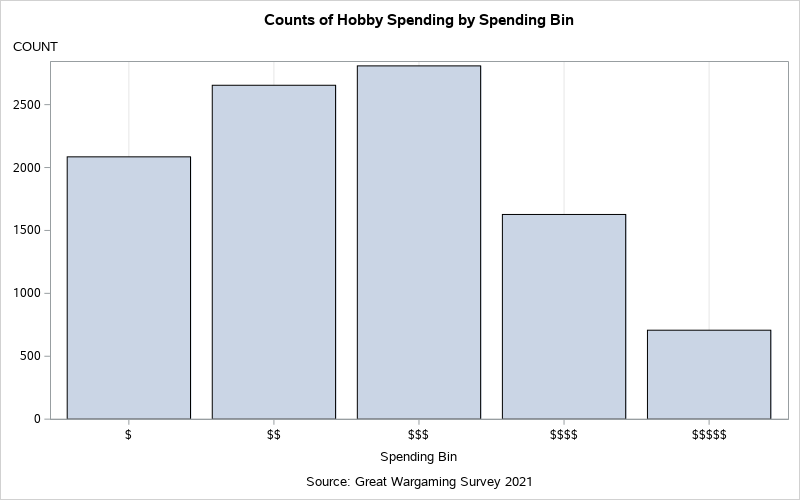
Hobby spending. For some, the amount spent on the hobby can be delicate subject. Accountability on the amount spent ranges from "I have no idea" to "I am an accountant, I track everything" and all stops in between.
Provided that survey respondents actually have a reasonable grasp on spending tendencies, what do the survey results suggest?
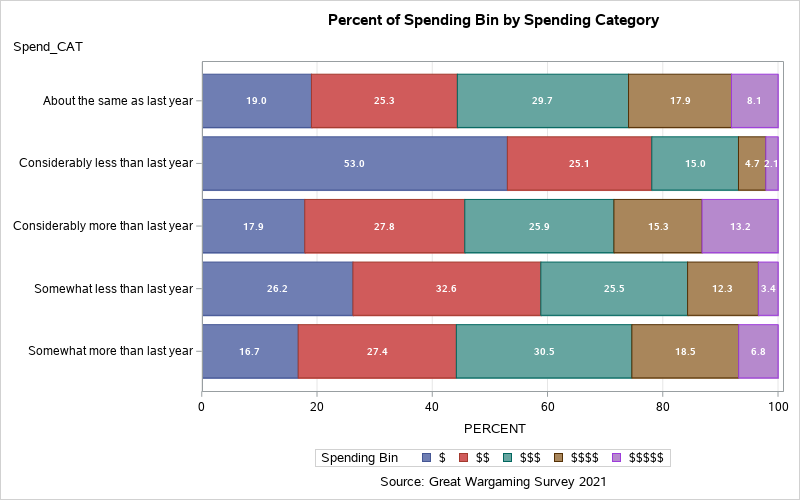 One interesting generalization pops out from the graphic above. Wargamers who tend to spend less now, expect to spend the same or even less next year. Conversely those wargamers tending to spend more, expect to spend the same or more.
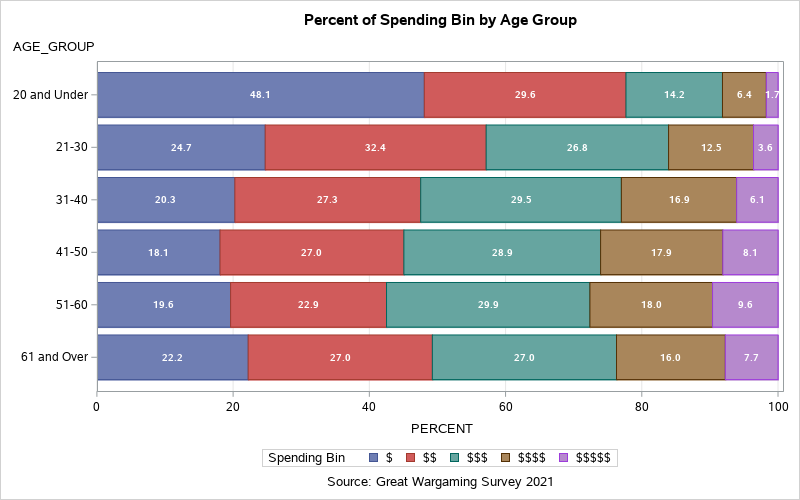
 For spending by age group, no surprises here. Annual spending tends to increase with age. The exception is in the 61+ age group. Here, the trend of expenditures increasing with age reverses direction. With increased life expectancies, perhaps it is time to break up the 61+ age group into more age cohorts? Maybe more age cohorts at the upper end would expose a more lifecycle approach to spending?
 Finally, consider wargaming periods by spending bin.
Recall that the survey asks for a respondent's Top 3 wargaming periods with no specification of ranking. Therefore, each respondent's Top 3 (or less) choices are aggregated to produce the graphic below.
What we see is that the Top 10 wargaming periods (in rank order of total counts) exhibit similar spending patterns. Variation exists across periods but generally spending is similar.
Finally, consider wargaming periods by spending bin.
Recall that the survey asks for a respondent's Top 3 wargaming periods with no specification of ranking. Therefore, each respondent's Top 3 (or less) choices are aggregated to produce the graphic below.
What we see is that the Top 10 wargaming periods (in rank order of total counts) exhibit similar spending patterns. Variation exists across periods but generally spending is similar.
 There is something of interest in the Spending by Top Wargaming Period graphic and it is not about spending. Although the favorite wargaming period question changed from ranked ordering of wargaming periods in the 2020 survey to choosing at most Top 3 without rank order in 2021, the same wargaming periods rise to the top in both.
World War 2 comes out on top as seen year after year with Science Fiction and Warhammer 40K rounding out the top 3. What interests me is that Ancients, Dark Ages, and Medievals make the Top 10 wargaming periods when aggregated into Top 3 choices. Does this suggest a cross-over between Fantasy/Sci-Fi to Historicals? Do fantasy/sci-fi wargamers migrate into historicals by way of these pre-1500 historical periods? I suppose time will tell.
Back to the question of spending. Do you track your hobby spending and into which Spending Bin do you find yourself? Are spending expectations the same from year to year or did spending expectations change in 2021. If so, how?
There is something of interest in the Spending by Top Wargaming Period graphic and it is not about spending. Although the favorite wargaming period question changed from ranked ordering of wargaming periods in the 2020 survey to choosing at most Top 3 without rank order in 2021, the same wargaming periods rise to the top in both.
World War 2 comes out on top as seen year after year with Science Fiction and Warhammer 40K rounding out the top 3. What interests me is that Ancients, Dark Ages, and Medievals make the Top 10 wargaming periods when aggregated into Top 3 choices. Does this suggest a cross-over between Fantasy/Sci-Fi to Historicals? Do fantasy/sci-fi wargamers migrate into historicals by way of these pre-1500 historical periods? I suppose time will tell.
Back to the question of spending. Do you track your hobby spending and into which Spending Bin do you find yourself? Are spending expectations the same from year to year or did spending expectations change in 2021. If so, how?
Spending Bins
The survey lists a series of upper and lower bounds for a number of spending ranges. Each range has conversion equivalents for a number of currencies. To make these various currency ranges more manageable for reporting purposes, these ranges are converted into Spending Bins denoting relative expenditures. The '$' system will be used to denote these bins. The conversions are:- $ -- 0 to £200 / €250 / $350
- $$ -- £201 / €251 / $351 to £400 / €440 / $500
- $$$ -- £401 / €441 / $501 to £800 / €880 / $1000
- $$$$ -- £801 / €881/ $1001 to £1600 / €2000 / $2800
- $$$$$ -- More than £1600 / €2000 / $2800
Expected Spending
Given that respondents specify level of spending, a follow-up question asks about expected spending for the next year. What does the survey show?
One interesting generalization pops out from the graphic above. Wargamers who tend to spend less now, expect to spend the same or even less next year. Conversely those wargamers tending to spend more, expect to spend the same or more.
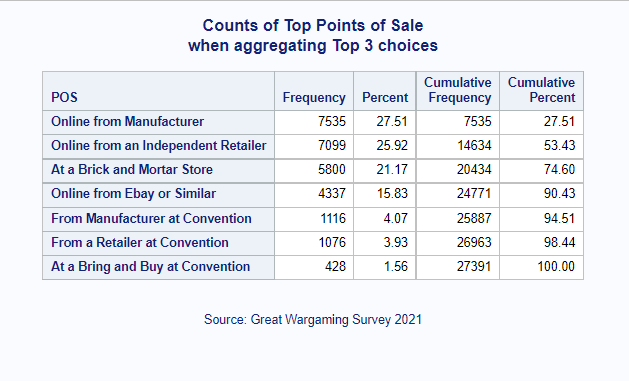
Points of Sale
One question asks respondents for their top 3 choices for points of sale. From the table below, online sales lead the way with purchases direct from manufacturer and independent retailers making up over 50% of responses. Add in purchases from ebay or similar and online purchases make up almost 70% of total sales.
Breaking the numbers down
Three of the attributes I enjoy exploring further in any analysis are Primary Interest, Age Group, and Wargaming Period. Does breaking down spending by these three attributes provide any insight? For spending by primary interest, all three categories show similar spending profiles. Note that Fantasy/Sci-Fi gamers tend to spend more in the mid-range bin ($$$) while Historical and Mixed wargamers tend to spend a little more than their Fantasy/Sci-Fi group.
For spending by age group, no surprises here. Annual spending tends to increase with age. The exception is in the 61+ age group. Here, the trend of expenditures increasing with age reverses direction. With increased life expectancies, perhaps it is time to break up the 61+ age group into more age cohorts? Maybe more age cohorts at the upper end would expose a more lifecycle approach to spending?
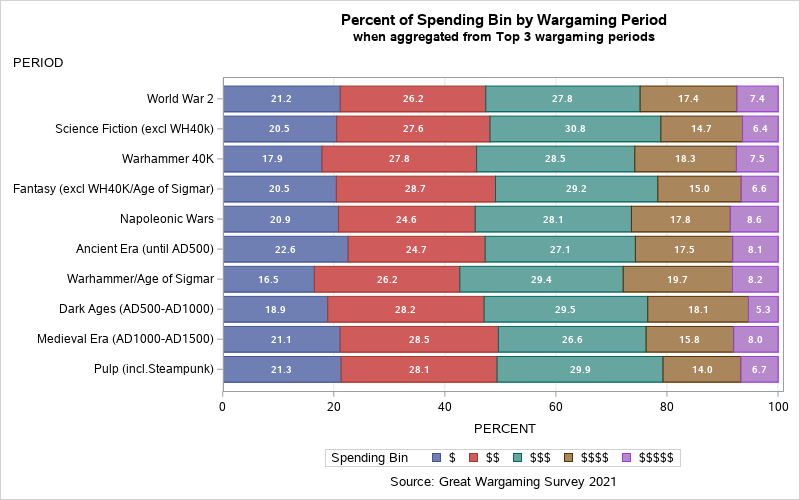
Finally, consider wargaming periods by spending bin.
Recall that the survey asks for a respondent's Top 3 wargaming periods with no specification of ranking. Therefore, each respondent's Top 3 (or less) choices are aggregated to produce the graphic below.
What we see is that the Top 10 wargaming periods (in rank order of total counts) exhibit similar spending patterns. Variation exists across periods but generally spending is similar.
There is something of interest in the Spending by Top Wargaming Period graphic and it is not about spending. Although the favorite wargaming period question changed from ranked ordering of wargaming periods in the 2020 survey to choosing at most Top 3 without rank order in 2021, the same wargaming periods rise to the top in both.
World War 2 comes out on top as seen year after year with Science Fiction and Warhammer 40K rounding out the top 3. What interests me is that Ancients, Dark Ages, and Medievals make the Top 10 wargaming periods when aggregated into Top 3 choices. Does this suggest a cross-over between Fantasy/Sci-Fi to Historicals? Do fantasy/sci-fi wargamers migrate into historicals by way of these pre-1500 historical periods? I suppose time will tell.
Back to the question of spending. Do you track your hobby spending and into which Spending Bin do you find yourself? Are spending expectations the same from year to year or did spending expectations change in 2021. If so, how?