2019 GWS - “Digging Into the Numbers: Hobby Spending – Age vs Interest”
In Jasper’s GWS 2019, Take my money! post, the question on planned hobby spending is addressed. Taking two components of Jasper’s summary, I dive into an analysis of hobby spending viewed by age group and primary hobby interest. Three questions examined include:
- Do differences exist between spending and age cohort?
- Do respondents who primarily favor Fantasy/Sci-Fi games spend differently than those gamers focused primarily on Historical games?
- Can inferences be made regarding the interaction of age group and hobby interest?
As in my prior post on “The Battle of the Bulge”, a foundation regarding assumptions and caveats needs to be in place before the analysis and inferences are presented. Of course, those earlier caveats still hold.
Primary hobby interest
First, a discussion on categorizing respondents based upon primary hobby interest.How do we assign a respondent’s primary interest? Question 11 asks:
Do you consider yourself mostly a historical, or more a sci-fi or fantasy wargamer?
Possible responses span an integer scale from Historical (0) to Fantasy/Sci-Fi (6). Making a judgment call, responses of ‘0’ or ‘1’ were classed as Historical gamers, responses of ‘5’ or ‘6’ classed as Fantasy/Sci-Fi gamers, and ‘2’,‘3’,’4’ classed as Mixed gamers. All responses for Primary Interest were recoded to these guidelines.
Hobby spending
Second, selections for hobby spending were given in spend bins with the following progression:
- ‘$’ - 0 to 200 GBP / 250EUR / 350USD
- '$$’ - 201 GBP / 251 EUR / 351 USD to 400 GBP / 500 EUR / 700 USD
- '$$$’ - 401 GBP / 501 EUR / 701 USD to 800 GBP / 1000 EUR / 1400 USD
- ‘$$$$’ - 801 GBP / 1001 EUR / 1401 USD to 1600 GBP / 2000 EUR / 2800 USD
- ‘$$$$$’ - 1601 GBP / 2001 EUR / 2801 USD or more
I added the ‘$’ symbols to aid in report displays. Reports and charts will be in USD.
Computing meaningful point estimate statistics from data built upon wide range bands that vary in size (exponentially!) requires another judgment. For this, I stuck with Miles’ precedent of using each ranges’ midpoint as the point estimate. For the ‘$$$$$’ spend band, I simply used the lower bound ($2,801 for USD). These are the averages Jasper reports in his Take my money! post. When dollars are shown, keep in mind these are means based upon range midpoints.
With the preliminaries out of the way, time to turn to the analysis.
Analysis
 First up is a look at Amount Spent by Age Group. What do we find? Over half of the respondents in the “20 and Under” group spends in the ‘$’ bin of under $350 annually. No surprise there. As a gamer ages, spending, on-balance, increases, but the majority of annual spending remains in the first three spend bins. From age 31 and over, about 28% of respondents spend between $700 and $1,400 annually on the hobby. Roughly 15% of respondents in the 31-60 age groups spend between $1,401 and $2,800 per annum. About 9% of the respondents in the 41-60 age groups spend over $2,800 annually. Notice that the 61+ group sees spending at the upper spend ranges decline. Still, this group spends on par with the 31-40 year olds.
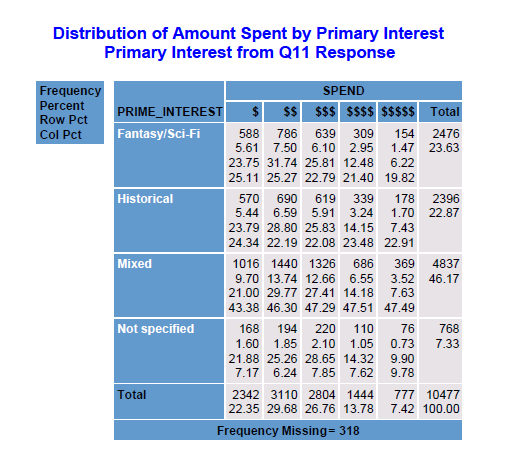 Next up is an examination of annual spend by primary interest. Primary interest is defined above and classifies respondents into four groups. These groups areFantasy/Sci-Fi, Historical, Mixed, and Not Specified. Some survey respondents did not choose a value for Question 11.
What can be gleaned from this table? The distribution of spending amounts is similar to the table showing amount spent by age group. The spending profile of Fantasy/Sci-Fi gamers looks very similar to the spend profile of those 40 and under. The data seem to suggest that the big spenders are those not specifying any primary interest. Historical gamers tend to have a few more big spenders than do the Fantasy/Sci-Fi gamers. Could this difference be age related?
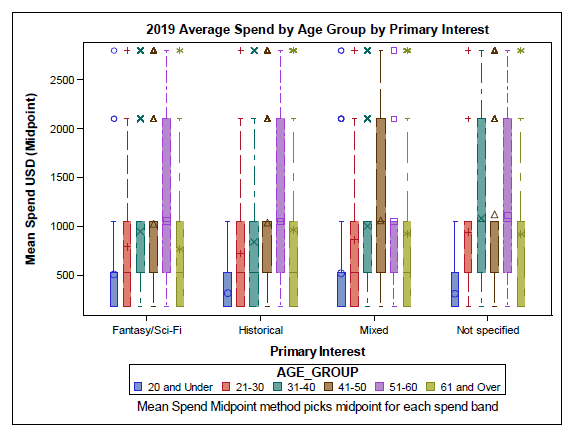 The next pair of charts moves away from analysis based upon spending bins and presents the data based on dollars spent. As explained in the foundational assumptions at the beginning of the post, these analyses use the midpoint of each spend bin to compute summary statistics. Now, the respondent may have an annual spend anywhere between the selected spend bin’s lower bound and upper bound but the assumption for this purpose is that the midpoint is the point estimate for every respondent.
 These two charts present the data in two distinct ways. The chart on the left, 2019 Average Spend by Age Group by Primary Interest, shows average age group spend grouped by primary interest. The chart on the right, 2019 Average Spend by Primary Interest by Age Group, average primary interest spend grouped by age group.
Observations
What inferences can be made from these two charts? Below are a few observations and generalizations but there are many more:
- As a group, the 20 and Under group spends the least, on average.
- The 40 and under groups spend tend to spend more on Fantasy/Sci-Fi than do those having Historical as a primary interest.
- The 51-60 age group, having found their primary interest, spend more than other age groups.
- The 61+ age group spends less when their primary interest is Fantasy/Sci-Fi than when Historical.
- The 61+age group is less likely to make large purchases than 31-60 age groups.
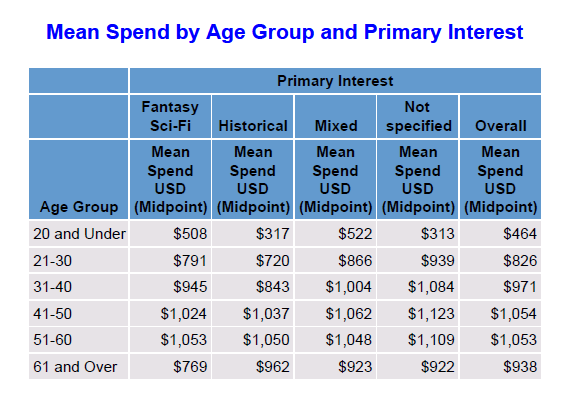 Switching from graphical representation to table, the survey results suggest that the 41-60 age groups, on average and in aggregate, spend more than the other groups. Notice that the 40 and under age groups tend to spend more when their primary interest is Fantasy/Sci-Fi. The 61+ group tends to spend more when their primary interest is Historical. What about the attributes of the Mixed category? This group tends to spend more at each age group than either Historical or Fantasy/Sci-Fi gamers. Perhaps with many interests and cross-over between Historical or Fantasy/Sci-Fi, this group naturally tends to spend more to satisfy their broader interests?
Answers!
Can the answers asked at the beginning of the post be answered? Yes.
- Spending tends to increase with age until reaching the 61+ age group.
- Respondents with a primary interest of Fantasy/Sci-Fi tend to spend less than the other primary interest groups.
- Respondents age 40 and below tend to spend more when their primary interest is Fantasy/Sci-Fi.
- Respondents age 41+ tend to spend more when their primary interest is Historical.
The results on hobby spending, intuitively, make sense although I am somewhat surprised by the apparent age split between Fantasy/Sci-Fi and Historical. Intuitive results are good and reinforce the integrity of the survey responses. As for planned hobby spending, I typically plan to spend less but often spend more. Perhaps these numbers under-estimate actual spending?
There are many ways remaining to dissect the spend data but that can be left for another time.One question that comes to mind is: does location matter?