Trajectory calculator
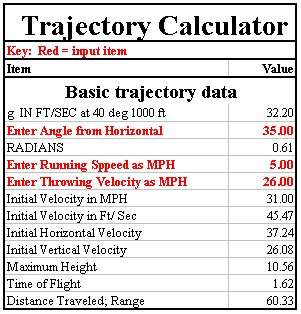 The fundamental formulas for the parabolic path of a missile can be entered into an Excel spreadsheet to product a Trajectory Calculator. The actual spreadsheet cannot be placed in an HTML page but an image of it can. The illustration on the left shows the initial part of my calculator. The items in red are for data entry.
This particular entry is for a throw at an angle from the horizon of 35 degrees, from a running speed of 5 miles per hour and launched with an initial velocity of 26 miles per hour.
The combined initial velocity is 31 MPH, 45.47 Feet per Second. The maximum height in the trajectory is 10.56 feet, the duration of the flight is 1.62 seconds and the missile will travel 60.33 feet -- ignoring the effects of air friction.
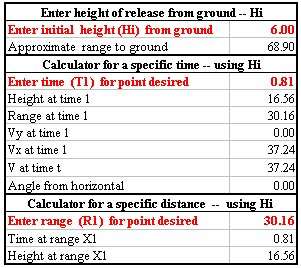 This illustration shows the next section of the calculator. It accepts an entry for the initial height of the trajectory. A man throwing an object, unless throwing side-arm, actually releases the object at 6 to 7 feet from the ground. This higher initial height extends the trajectory to about 68.9 feet.
The next section calculates the position of the object at any given time during the flight. The entries here are for the mid-point. The height at that time is 16.56 feet, 6' higher than the 10.56 feet given in the box above because of the adjustment for initial height.
The third section calculates the time and height for any distance. Again, the entries are for the mid-point of the trajectory.
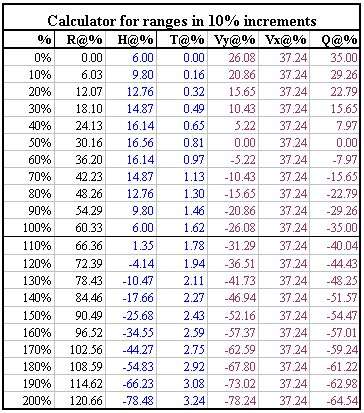 This part of the calculator shows the calculated Range, Height, Time, Velocity in the Y coordinate, Velocity in the X coordinate and Angle from the Horizontal (Q) for various points along the path. The calculator is set for 10% increments in the range.
The bottom half extends the trajectory to 200% of the maximum range. This portion would only apply if the object were thrown from an additional height, such as a wall or hill.
Excel can also chart the data visually. A chart of the trajectory path appears below.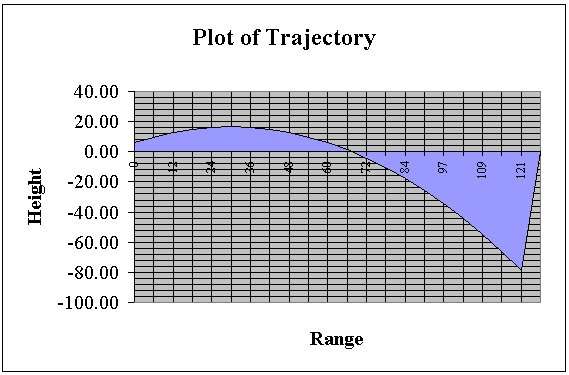
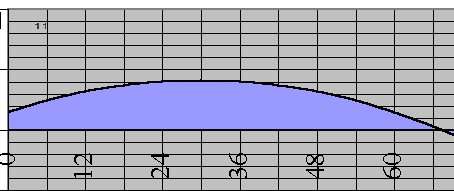
The illustration below is a detail of the chart above showing just the main part of the trajectory. On the left the 6' launch height is visible because the path does not start at the zero line. On the right the point at which the trajectory meets the ground can be seen -- approximately 69 feet.
While Excel can chart the data it is not particularly useful as an imaging tool since it sets the increments for vertical and horizontal distances in an arbitrary fashion. The chart reflects the data but not the actual path taken. To produce an image of the path the data has to be plotted by software that retains both x and y coordinate distances accurately. I used AutoCAD to draw the actual paths of objects.
The value for g used above is approximate. For 40 degrees of latitude and an altitude of 1,000 feet above sea level the value of g is 32.15. Its actual value for other latitudes and altitudes can substituted to give a more accurate path. However, since the effects of wind and air-resistance are not taken into consideration, the errors caused by an approximation of g are probably not significant.
Using the Excel "Goal Seek" function it is possible to reverse-calculate any element in the path. It would calculate the velocity with which an object must be thrown to travel a set distance at a given angle of launch.