GWS 2016 - first glance at the results
Before we delve into the awesome amount of data for analysis and further reports, I thought it’d be interesting to provide a quick overall glance at the respondents of the Great Wargaming Survey of 2016. Between July 19 and August 19, 9997 people took the survey (actually, there was at least one more but that was so obviously a troll entry that we deleted it). According to SurveyMonkey, 93% of those completed the survey (ie: clicked the ‘Done’ button at the very end), the exact same percentage as in 2014 and 2015.
Because we’re in the awkward position of not knowing the size of the population - we don’t know how many wargamers there are worldwide - it’s best to state that all results only speak to the opinions and attitudes of the respondents. However, just for curiosity’s sake, I filled out Surveymonkey’s Sample Size Calculator to see the kind of population a sample this size would require. If you play around with that calculator, it quickly becomes apparent that the population size a sample can speak for is entirely dependent on the desired confidence level and margin of error. For instance, for a population of 1 million and a desired probability of 95% that the sample accurately represents the population with a 1% margin of error, one would need a sample size of 9513 responses. Take that for what you will.
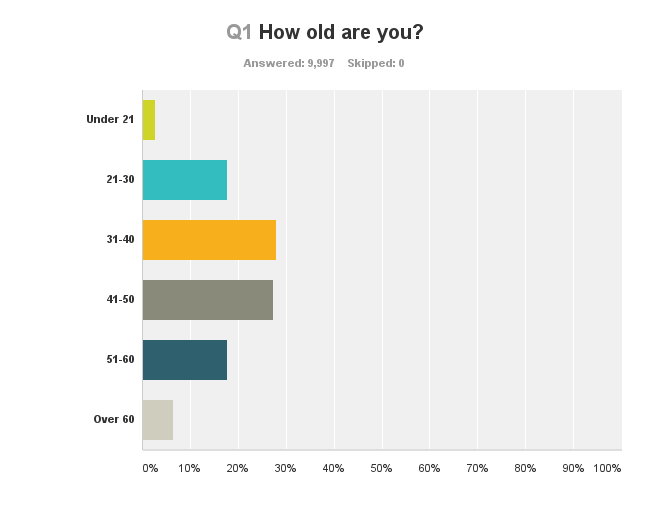 Age-wise, the graph for the age groups looks more like a nice parabola than in previous years and they’re still almost all male (though 1.9% is female, a slight increase again). Unlike previous years, where we asked for general regions people live in, this year we asked for their country. Respondents came from 74 countries, though only from 31 did we get more than 10 responses. The top 10, UK, US, Australia, Canada, Germany, Netherlands, Italy, Spain, Sweden and New Zealand, account for 87.8% and just the UK and US for 62.6%. Finally, for 65% of respondents this is the first time they took part in the survey.
More on wargaming later!